In this post, I will present a project I worked on over the last few months. Months ago, when I was looking for a tool capable of plotting Johnson-Cook model curves based on Johnson-Cook parameters, I couldn’t find one, so… I made one! Hopefully, my web app will come in handy for anyone who finds themselves in the same situation in the future!
Disclaimer: This is a niche application in the field of materials science engineering! But keep reading!
App
Click here to head to the Johnson-Cook Model Plotter:
jc-plotter.matsan.it
It may take up to 10-20 seconds to load the app after clicking the link.
![]()
Logo and favicon of the web app resembling a stress-strain curve!
Background
A few months ago, I was working on modeling the behavior of metals, specifically titanium alloys, under extreme conditions. One model used for this purpose in the literature is the Johnson-Cook model.
The Johnson-Cook model is a widely used constitutive material model that describes the flow stress of metals as a function of strain, strain rate, and temperature. It is especially valuable for simulating the behavior of materials under high strain rates and elevated temperatures, such as in machining, impact, or explosive events.
A typical plot of the Johnson-Cook model shows flow stress versus plastic strain at various strain rates and temperatures. This illustrates how a material’s strength evolves during deformation under different conditions.
While searching the internet for websites offering plots of Johnson-Cook curves based on given parameters, I could not find one. For that reason, I decided to create one myself and make it available to anyone, so that someone in my position in the future can take advantage of this resource.
Front End
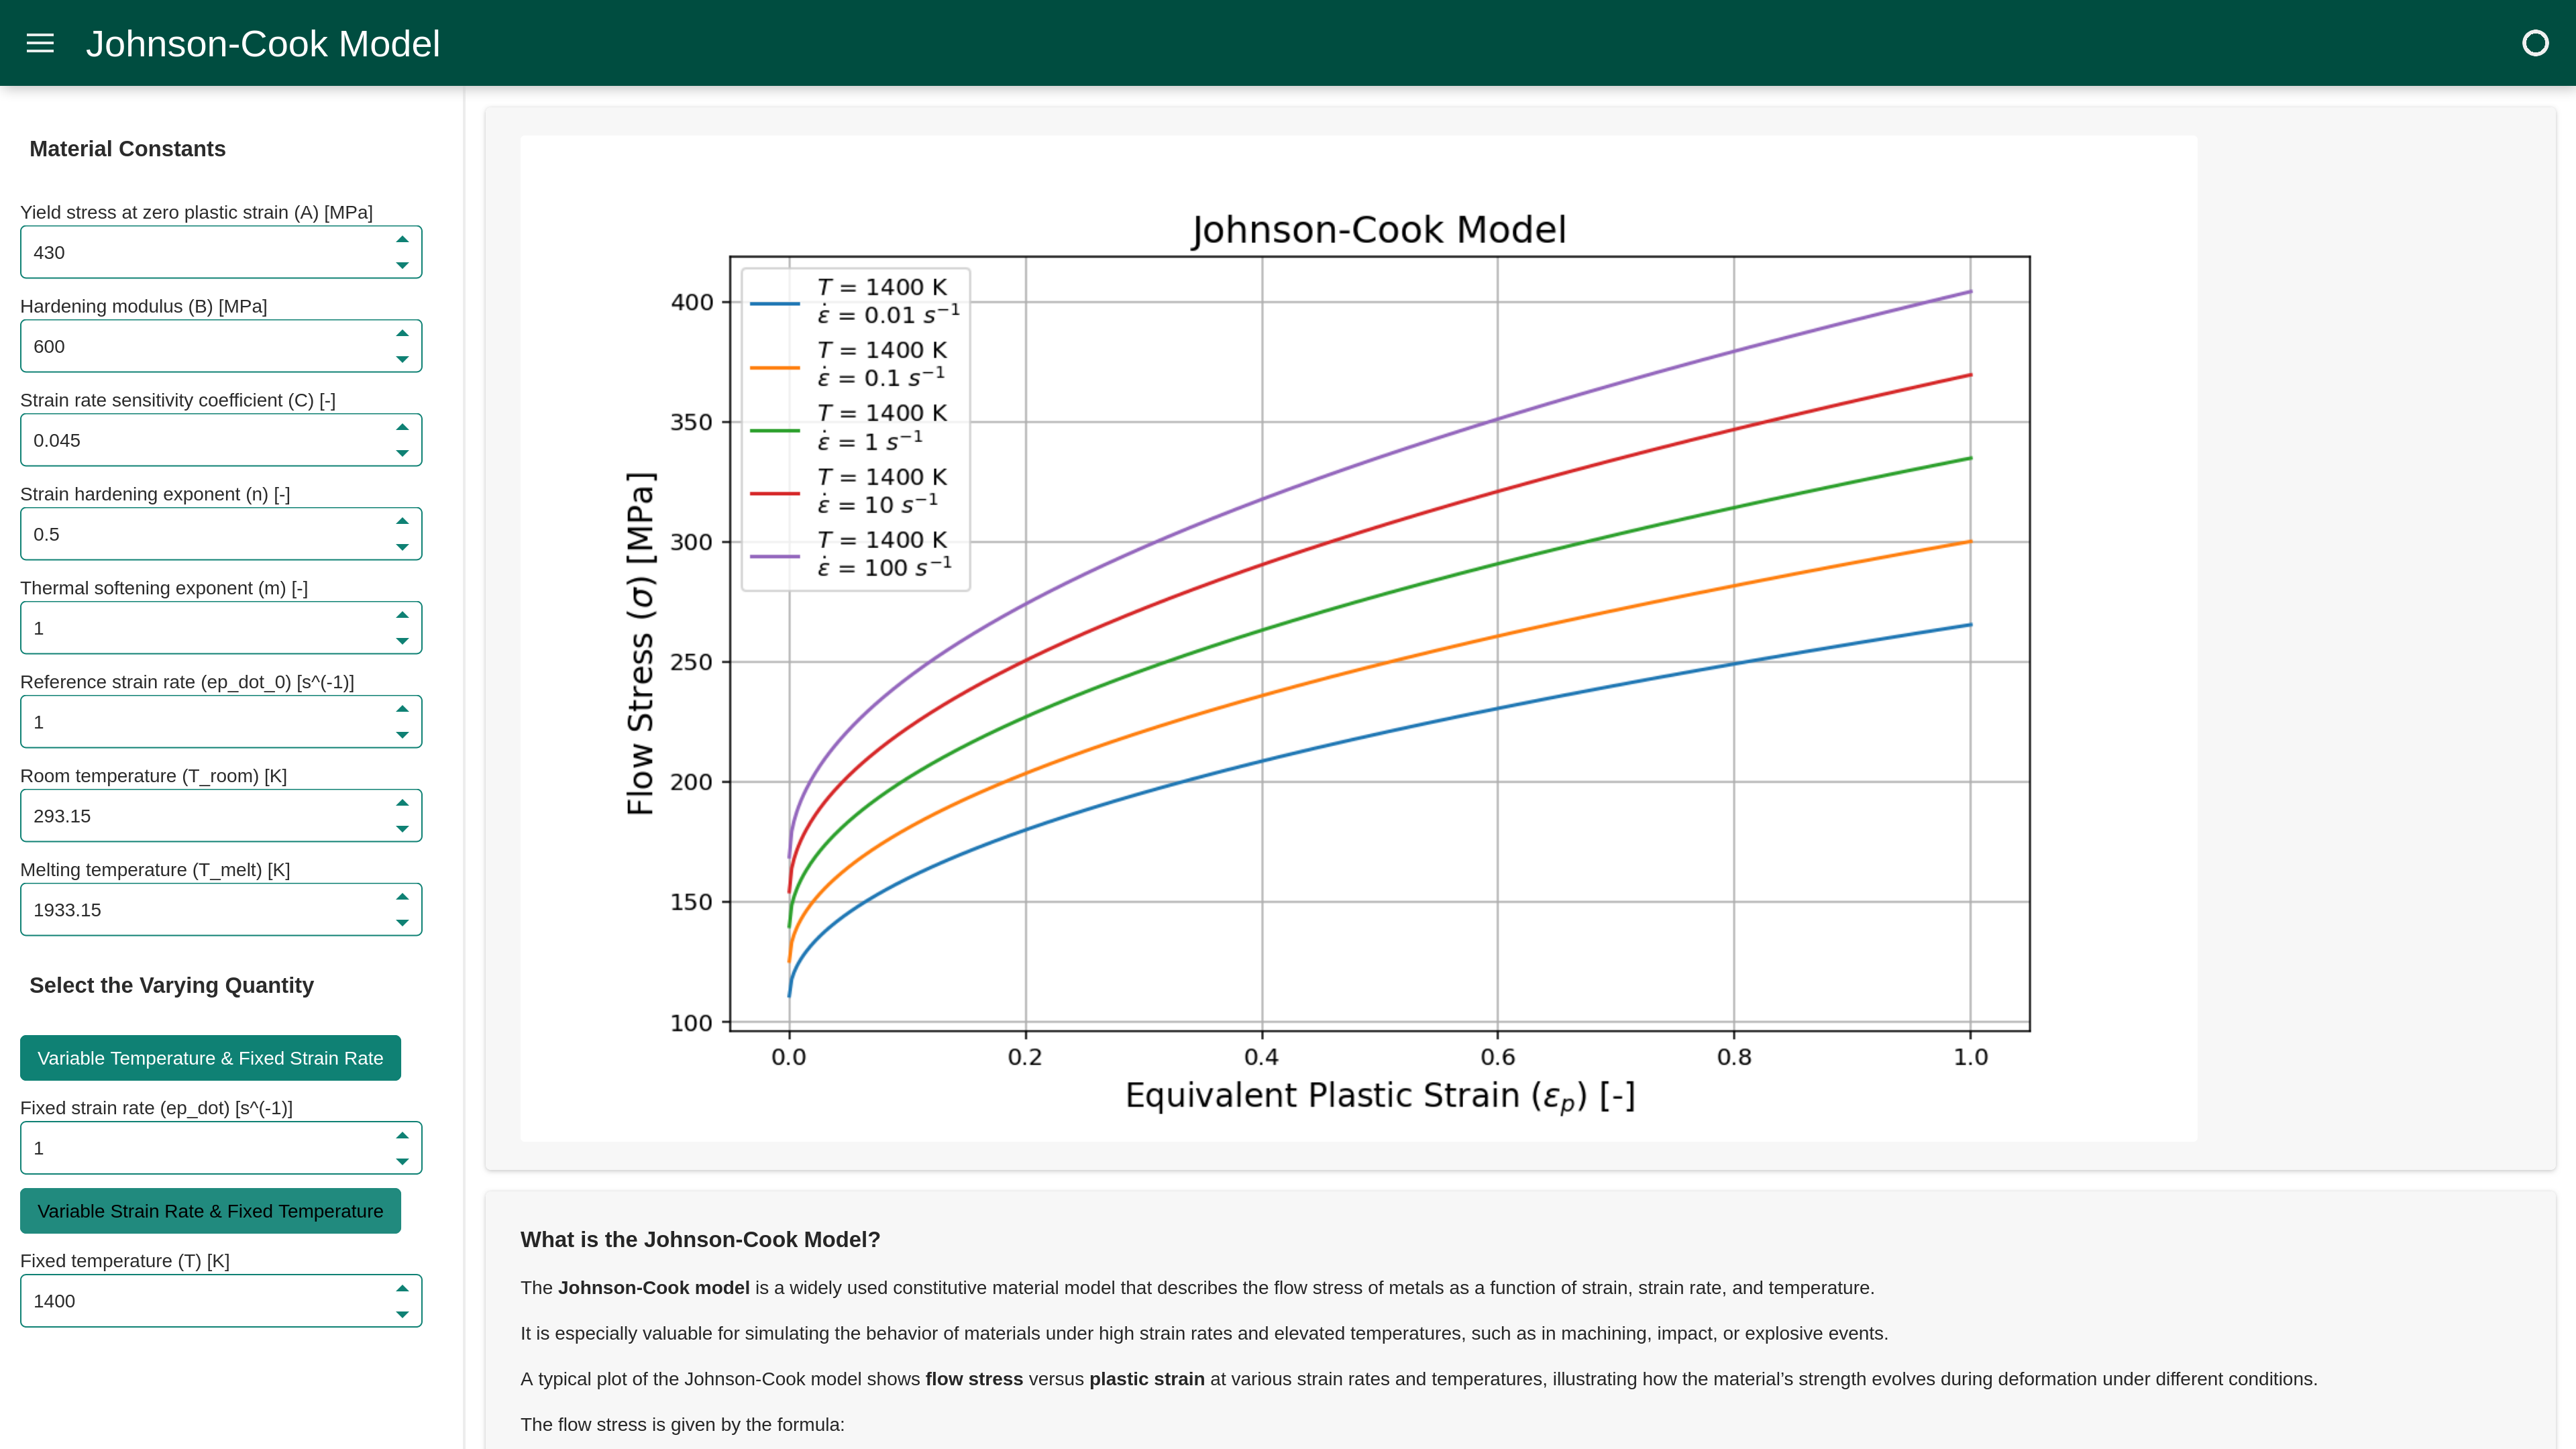
Below, you can find some screenshots showing the app and its features.
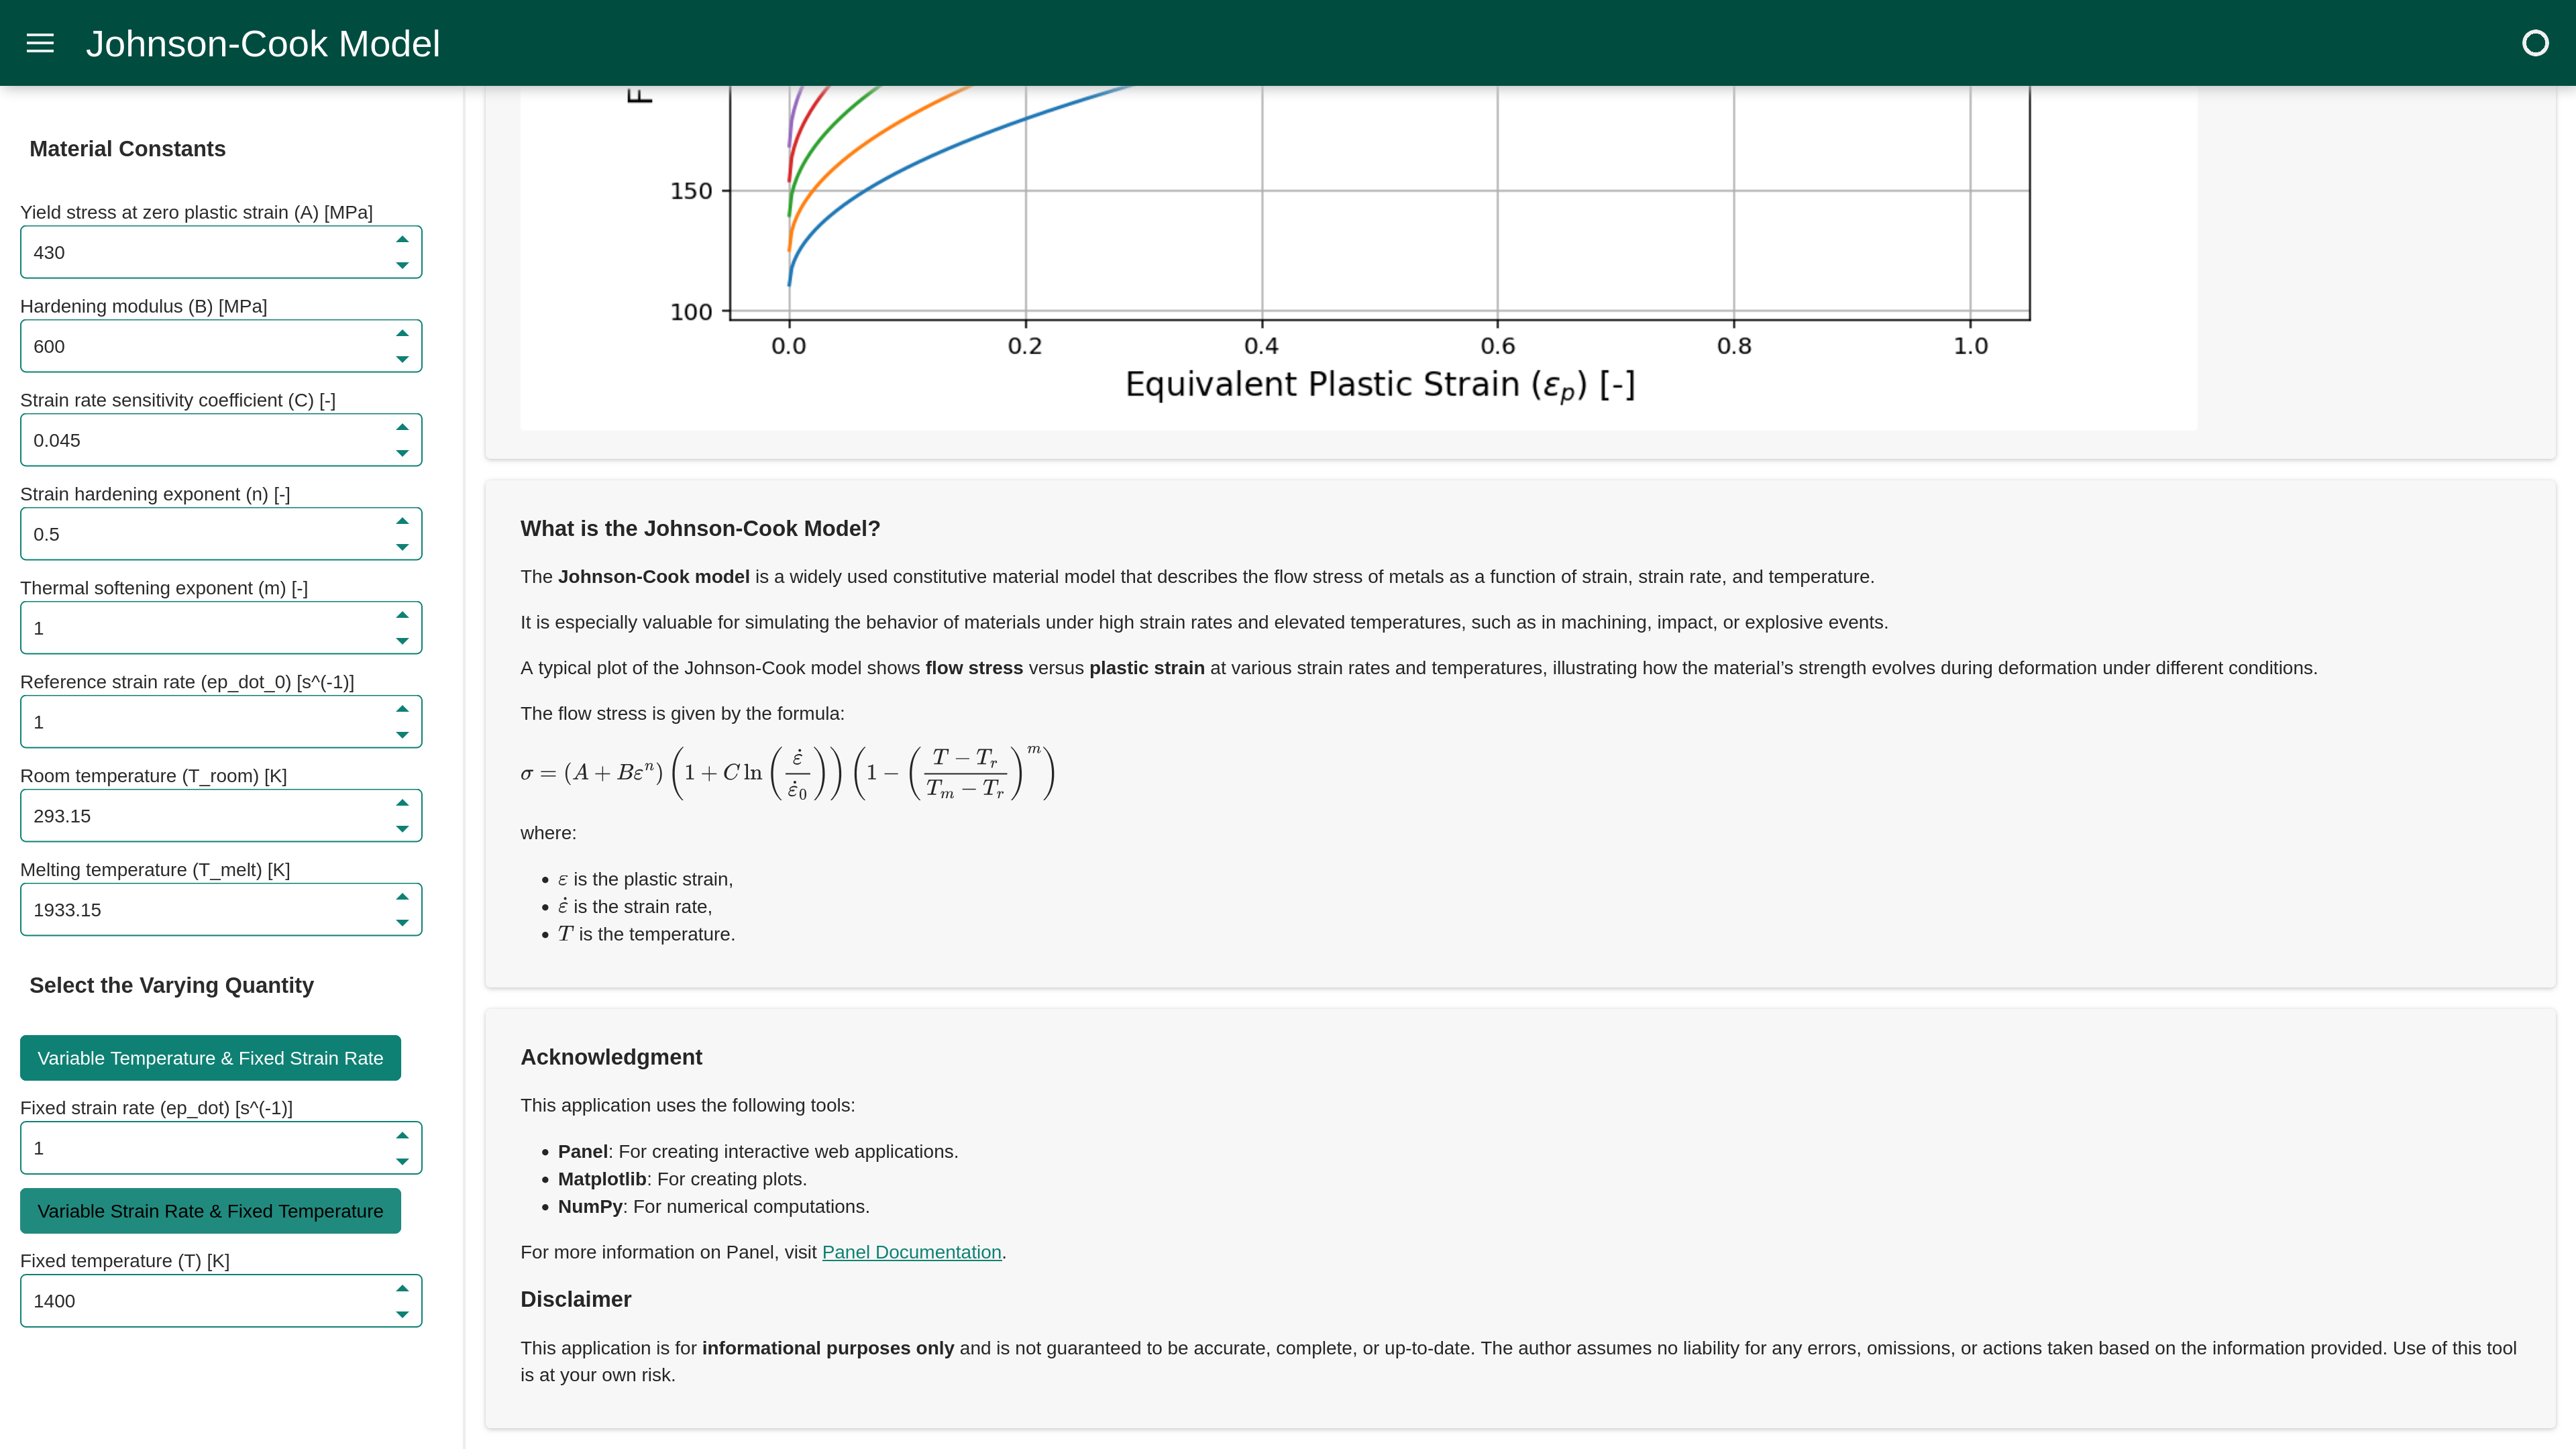
Using the sidebar on the left, the parameters can be adjusted. The plotting mode can be changed by selecting which quantity (temperature or strain rate) stays constant and which quantity varies.
The main section has three panels. The actual plot takes center stage. Below, there is a brief summary of the Johnson-Cook model, along with its equation. The last section serves as an acknowledgment and disclaimer, mentioning the tools used.
Screenshots
Tools
This project was an opportunity for me to experiment with a tool that I had been interested in trying out for a while. This project was the perfect application, so I jumped in and started experimenting.
The entire web application is written in Python and uses the Panel library (by HoloViz) for the dashboard and GUI. Panel makes it very easy to code and build good-looking dashboards, plotters, and other visualization tools. I can’t recommend this enough! The other two key tools I used are Matplotlib (for creating the plots) and NumPy (for numerical computations).
Deploy
Deploying the app and making it accessible on the Internet is the second phase of the project. Considering how lightweight and resource-efficient the web app is, I was hoping to find an easy hosting solution.
Starting out, I looked into free options to host the demo while researching better solutions (like self-hosting?). I considered Render.com, but ultimately landed on Koyeb.com. These tools make it easy to deploy from a GitHub repository, but, as expected, the free plans are limited in terms of performance and fluidity. I will look into better (paid) options, but for now, I’m okay with having the demo app hosted there.
Update!
I moved the Johnson-Cook Model Plotter from traditional server-side hosting (like Koyeb, which I was using before) to a Client-Side WebAssembly architecture. Previously, every time a user performed a calculation on the website, the app had to send a request to a remote Linux server to perform the calculations, resulting in lags and limitations on the free plan, which degraded usability.
I migrated to Cloudflare Pages and Pyodide, shifting the computations to the user’s browser. Now, after an initial download on the first visit, the application downloads the necessary Python engine, allowing all the computations to remain on the user’s device. Essentially, I moved to a Serverless Static Web App so that after the first download, the performance is the best possible without even needing external server access!
I am really happy that I took the time to find this elegant solution, which solved the negative points I had with the previous solution!
Future
I plan to release the web app as an open-source project with a public repository on GitHub. Until then, I’ll continue working on it and preparing it for release.
Feel free to contact me if you find this tool useful or if you have any suggestions!
Ciao!